Be the first to know
when
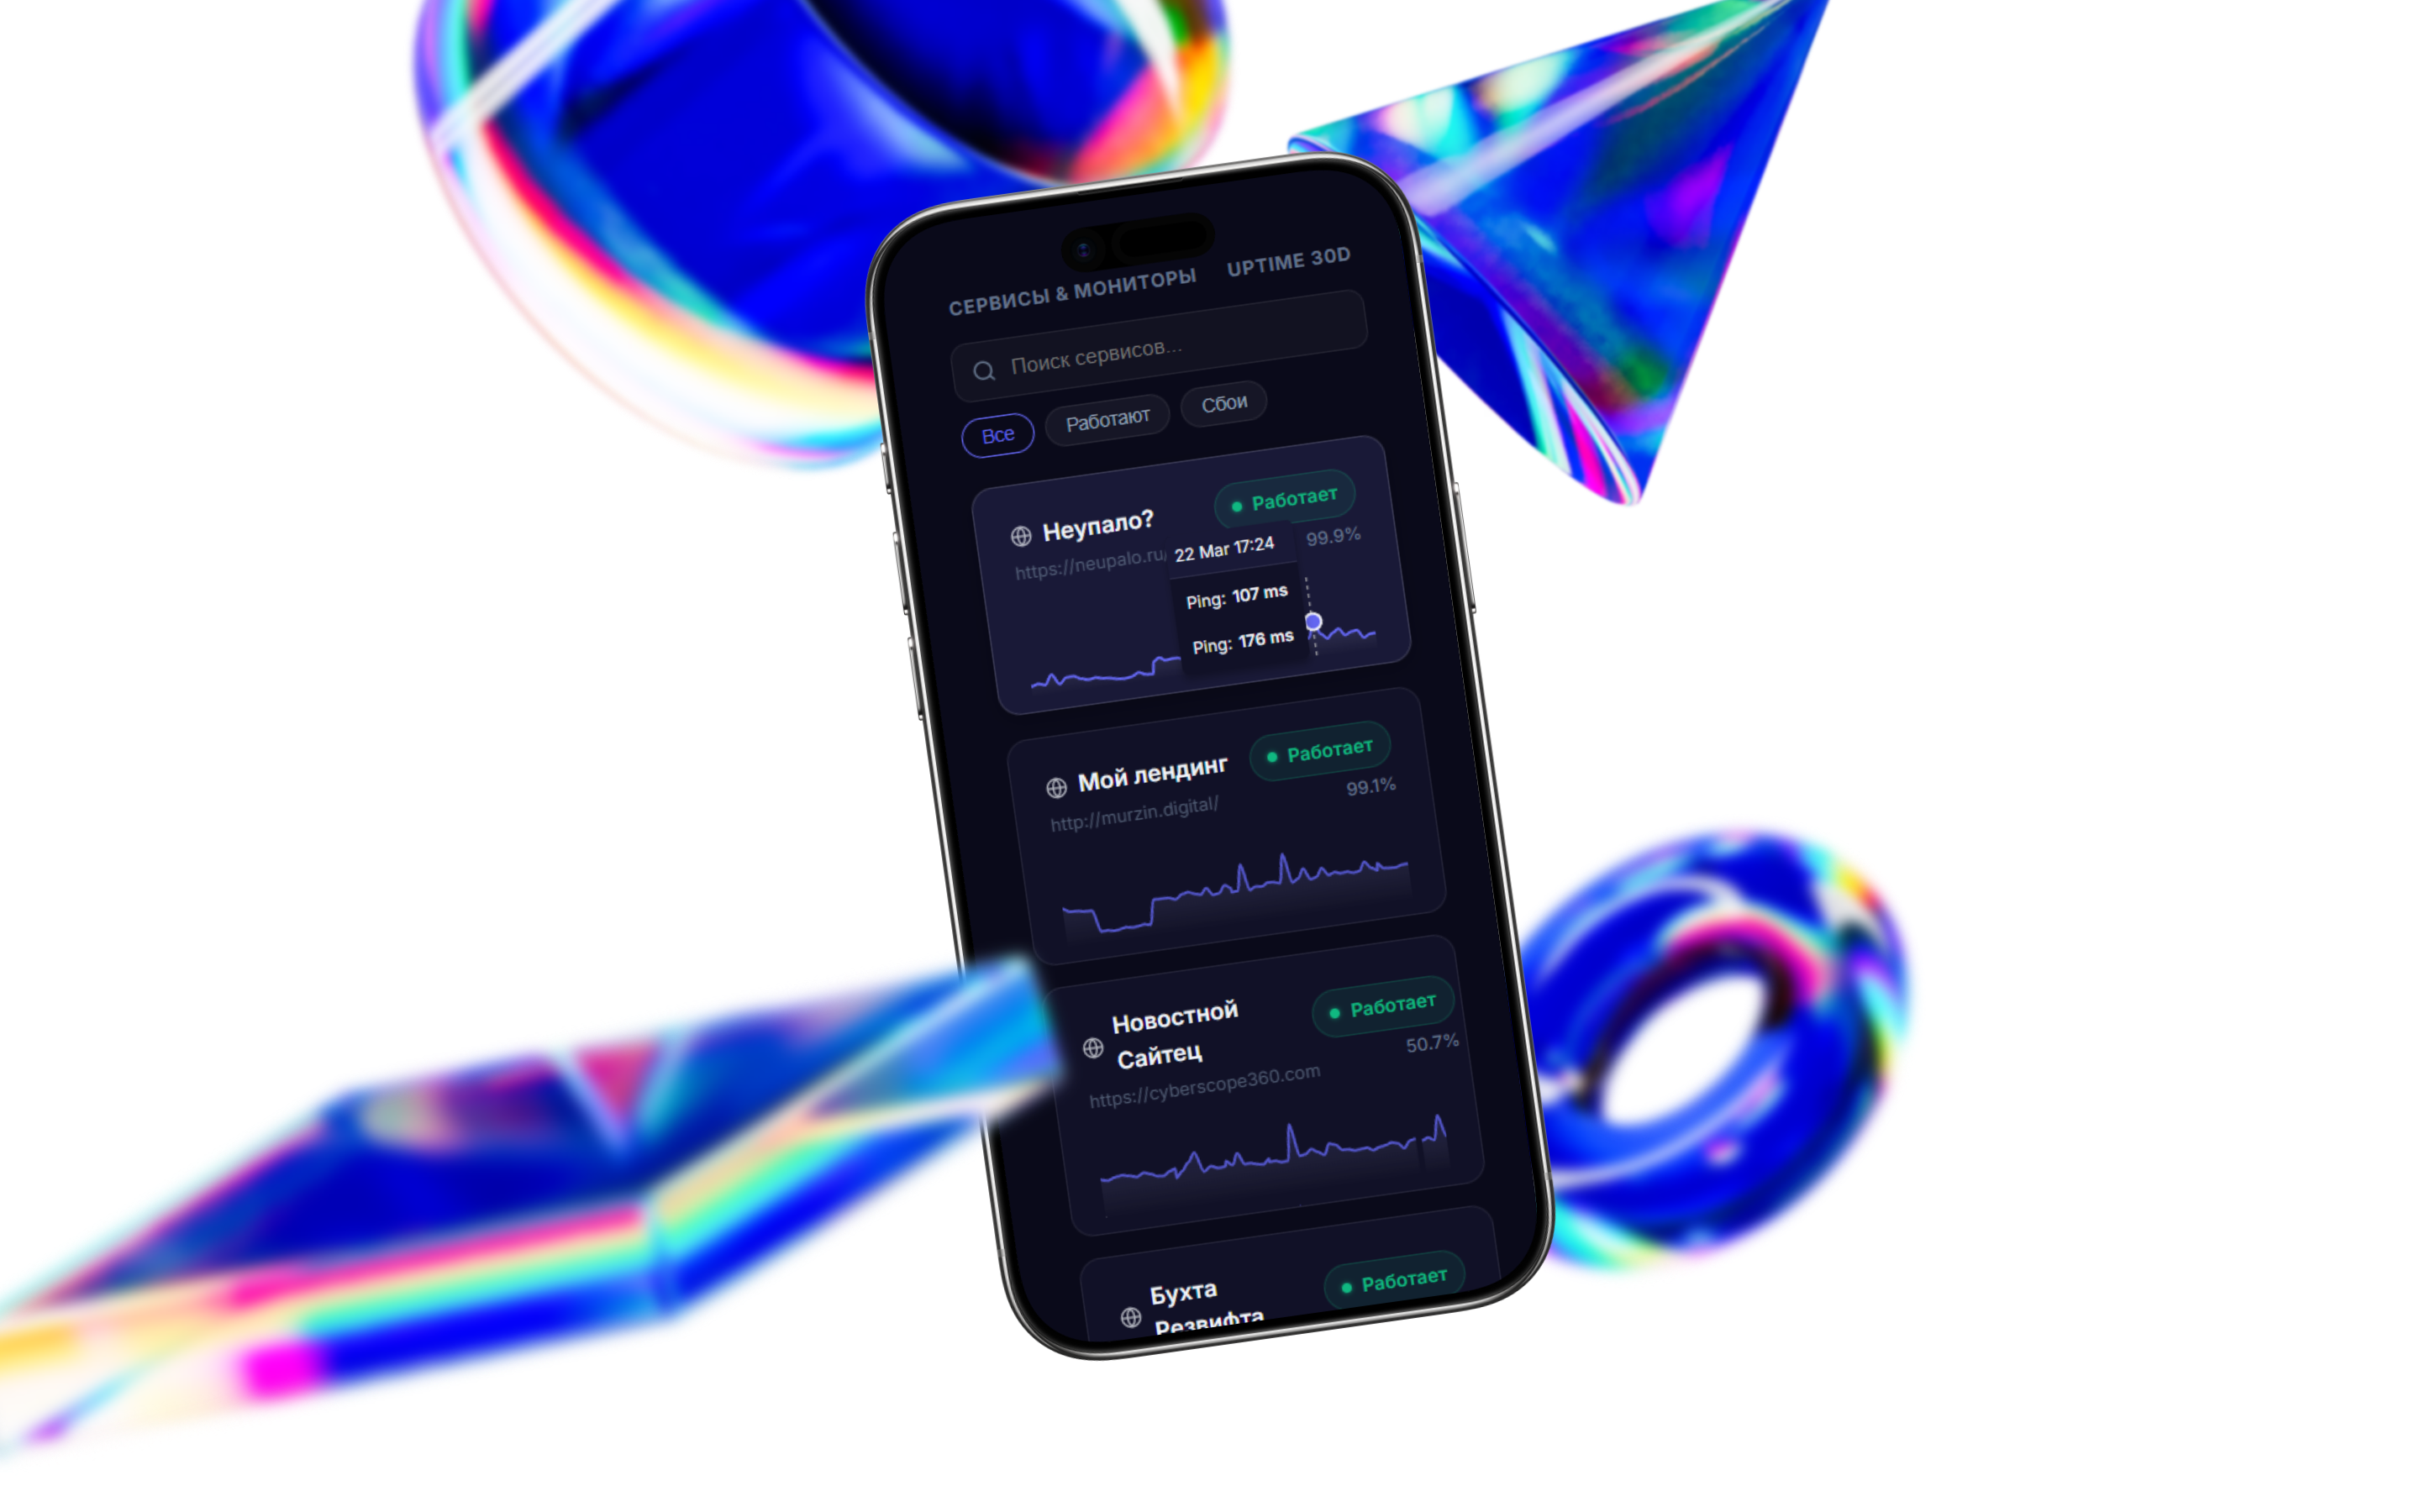
Know before your users do. Valpero checks your sites every minute from multiple regions — and fires an alert the moment something breaks.
Up and running in 2 minutes
No documentation to read. No infrastructure to set up.
Why you're losing customers
Every minute of downtime means lost revenue and broken trust.

Site went down overnight — you found out from customers in the morning
While you sleep, customers go to competitors. Average detection time without monitoring is 4 hours.
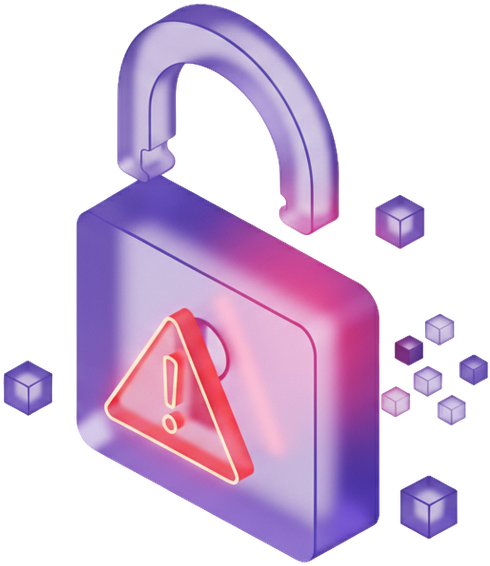
SSL certificate expired — Chrome is scaring your visitors
The browser shows "Not Secure". 85% of users immediately leave such a site.

You don't know how long your site was down
Without check history, you can't dispute hosting claims or measure the real impact of outages.
Everything you need, no setup headaches
Start monitoring in 2 minutes. No documentation to read, no complex integrations.
Fast Checks
HTTP/HTTPS checks from multiple regions every 1–10 minutes. Know about downtime before your users do.
Instant Alerts
Email, Telegram, Slack, Discord, SMS, or Webhook. Get notified in seconds, not hours.
SSL Monitoring
Automatic certificate tracking. Warnings 7, 3, and 1 day before expiry — on every plan.
Status Pages
Public status page for your customers. Build trust during incidents — fewer support tickets.
Multi-Region
Checks from Frankfurt, Helsinki, Bucharest, and more. No single point of failure in detection.
Incident History
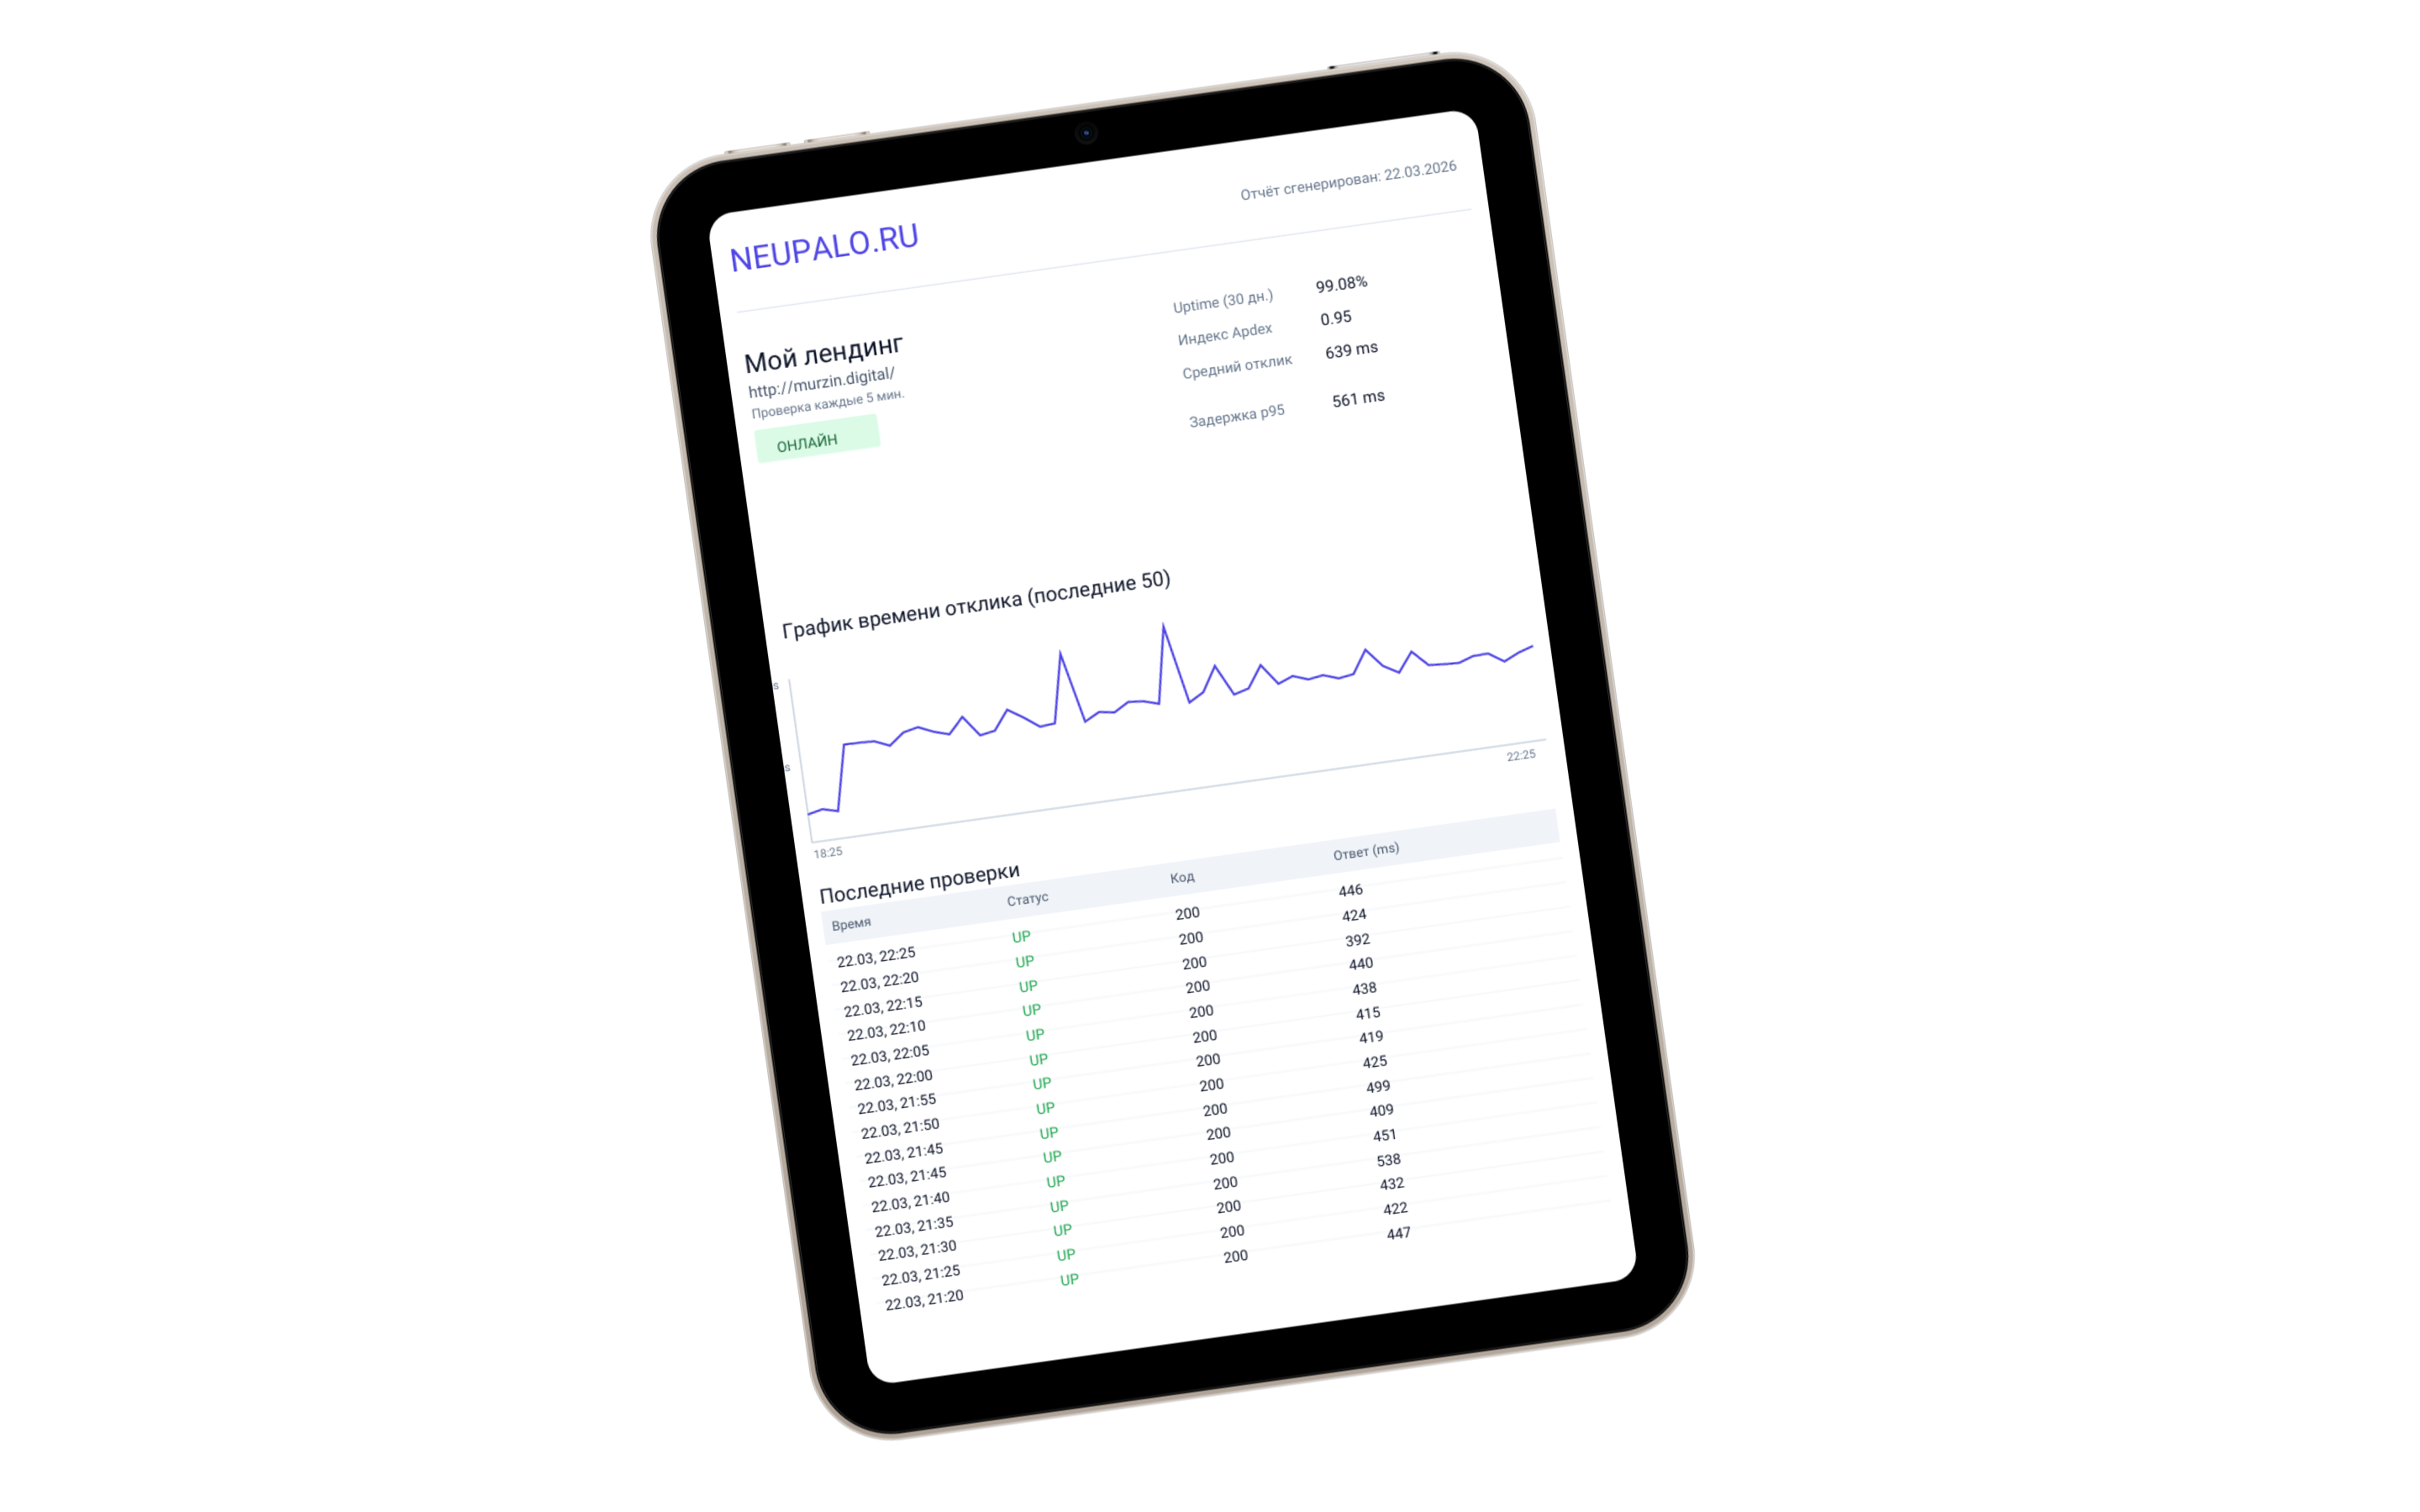
Full timeline of every outage. Response times, error codes, and screenshots — all logged automatically.
Alerts reach you where you already are

Transparent pricing, no surprises
Start free, scale as you grow.
- 1 monitor
- Check every 10 minutes
- 1 region
- SSL monitoring
- Email alerts
- 5 monitors
- Check every 5 minutes
- 2 regions
- SSL monitoring
- Email + Telegram + Webhook
- 30-day history
- 1 public status page
- 20 monitors
- Check every 3 minutes
- All regions
- SSL monitoring
- Email + Telegram + Webhook + SMS
- 90-day history
- Multiple status pages
Frequently asked questions
Uptime monitoring is the automatic checking of your website's availability. Our service sends a request to your site every few minutes and verifies it responds correctly. If your site goes down — you get an instant notification.
It depends on your plan: Free — every 10 minutes, Start — every 5 minutes, Pro — every 3 minutes, Business — every minute. You can change the interval in the site settings.
The primary channel is email. Webhook notifications are also supported for integration with Discord, Slack, or your own systems. Alerts are sent on both site down and site recovery.
Yes! SSL monitoring is included free on all plans. We check certificate validity and warn you 7, 3, and 1 day before expiry so you have time to renew.
Checks are performed from a global network of monitoring nodes across North America, Europe, and Asia-Pacific. This lets you track your site's availability for users around the world.
Trusted by teams who ship fast
"We switched from UptimeRobot after missing a 40-minute outage. Valpero caught our next incident in under 60 seconds and alerted us via Telegram before any user noticed."
"The multi-region monitoring is a game changer. We discovered our CDN was misconfigured in Asia — something we never would have caught with single-location checks."
"Free plan with SSL monitoring? That's what got me in. Now our whole team is on Pro — the status page alone saves us hours of support tickets during incidents."